
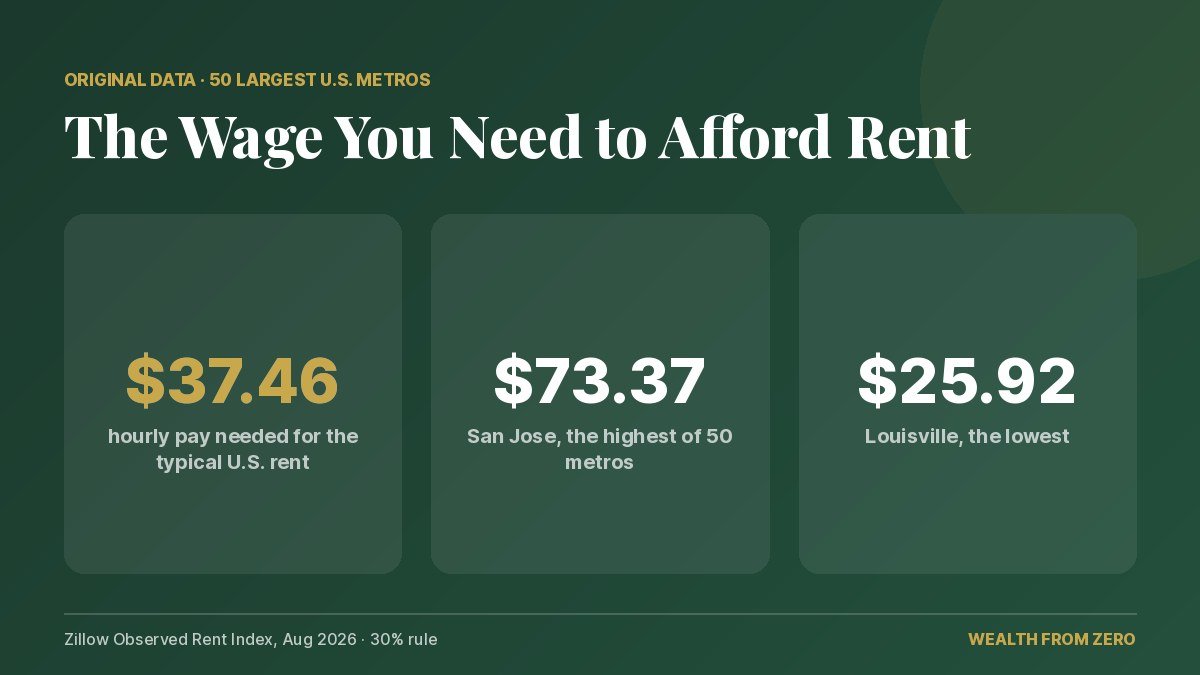
Key findings: to keep the typical U.S. rent of $1,948 a month at 30% of gross income, you need to earn about $77,900 a year, or $37.46 an hour working full time. We ran the same math for the 50 largest U.S. metro areas using the Zillow Observed Rent Index for August 2026. The wage needed ranges from $25.92 an hour in Louisville to $73.37 an hour in San Jose, and in none of the 50 metros is the typical rent affordable on a single $15-an-hour or even $25-an-hour full-time income.
The Headline Numbers
- U.S. typical rent: $1,948 a month, up 2.5% from a year earlier and up about 40% since August 2019.
- Income needed (30% rule): about $77,900 a year, or $37.46 an hour full time.
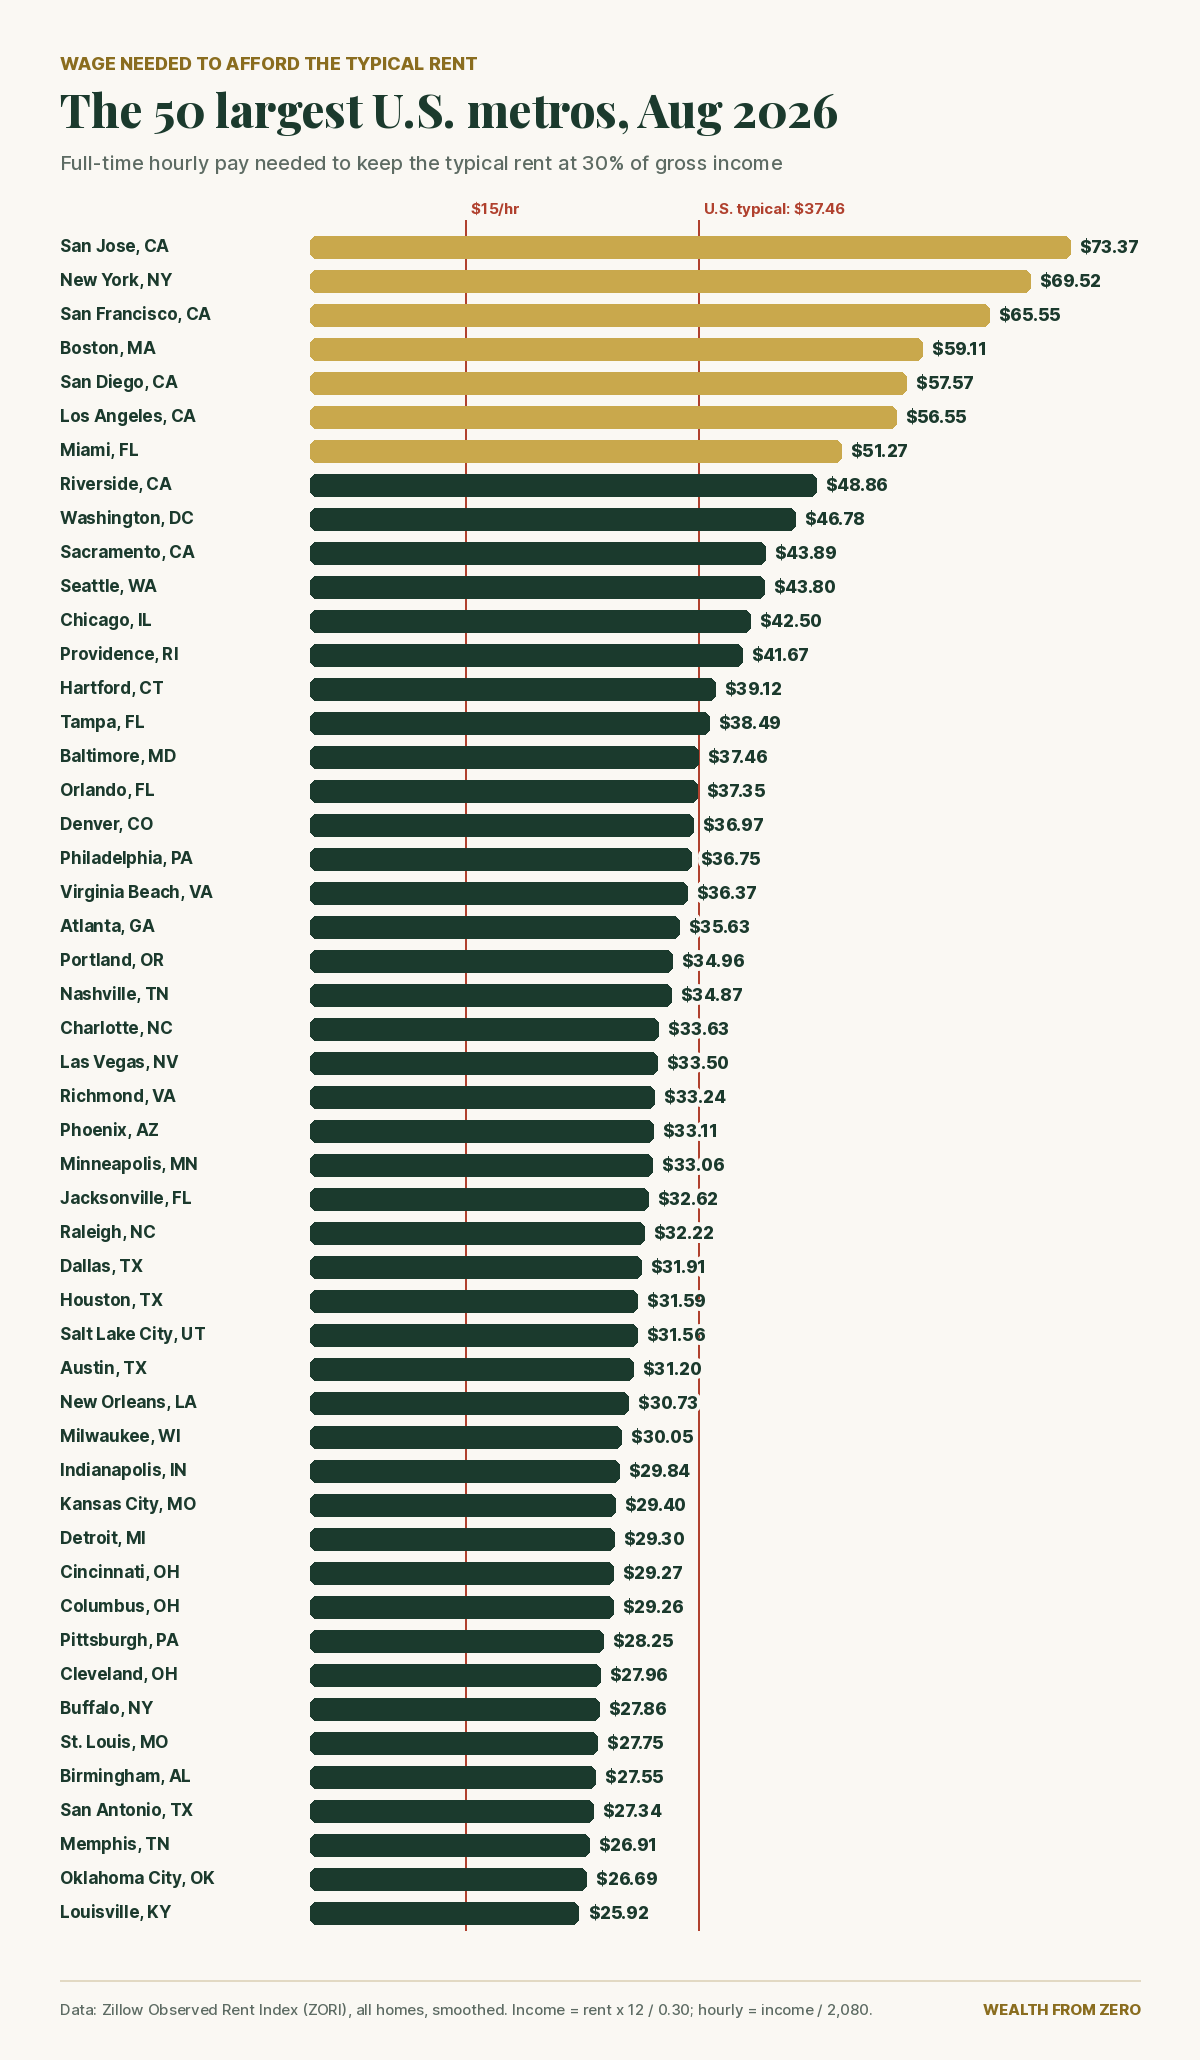
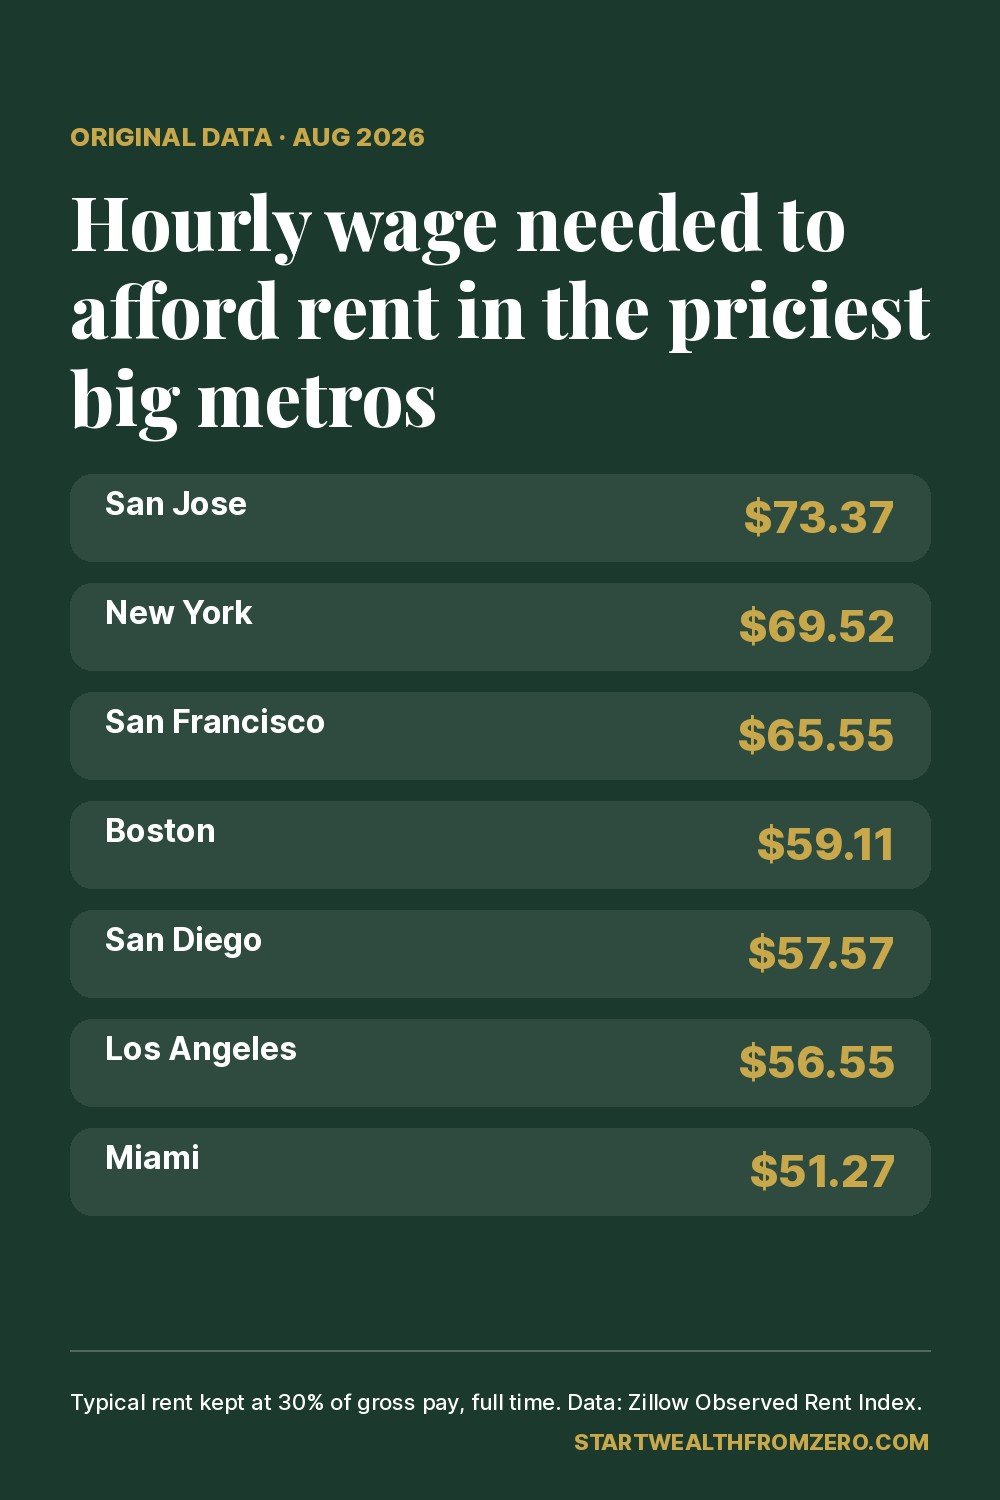
- Metros needing more than $50 an hour: 7 — San Jose, New York, San Francisco, Boston, San Diego, Los Angeles and Miami.
- Metros needing more than $30 an hour: 36 of 50.
- At $15 an hour: one month of the typical U.S. rent takes about 130 hours of pre-tax work — more than three full-time weeks.
- Two earners at $15 an hour ($62,400 combined) can keep the typical rent under 30% in only 14 of the 50 metros, all in the Midwest and South.
Income Needed to Afford Rent in the 50 Largest Metros
Ranked from most to least expensive. “Hours at $15/hr” is how many hours of pre-tax pay at $15 an hour it takes to cover one month of the typical rent.
| # | Metro area | Typical rent (Aug 2026) | Yearly income needed | Hourly wage needed | Hours at $15/hr | Change vs. Aug 2025 |
|---|---|---|---|---|---|---|
| 1 | San Jose, CA | $3,815 | $152,606 | $73.37 | 254 | +7.6% |
| 2 | New York, NY | $3,615 | $144,600 | $69.52 | 241 | +4.2% |
| 3 | San Francisco, CA | $3,409 | $136,351 | $65.55 | 227 | +10.8% |
| 4 | Boston, MA | $3,074 | $122,942 | $59.11 | 205 | +2.4% |
| 5 | San Diego, CA | $2,994 | $119,745 | $57.57 | 200 | +2.0% |
| 6 | Los Angeles, CA | $2,941 | $117,622 | $56.55 | 196 | +1.6% |
| 7 | Miami, FL | $2,666 | $106,642 | $51.27 | 178 | +1.6% |
| 8 | Riverside, CA | $2,541 | $101,634 | $48.86 | 169 | +2.8% |
| 9 | Washington, DC | $2,433 | $97,300 | $46.78 | 162 | +0.8% |
| 10 | Sacramento, CA | $2,282 | $91,294 | $43.89 | 152 | +1.7% |
| 11 | Seattle, WA | $2,278 | $91,104 | $43.80 | 152 | +1.7% |
| 12 | Chicago, IL | $2,210 | $88,398 | $42.50 | 147 | +4.9% |
| 13 | Providence, RI | $2,167 | $86,676 | $41.67 | 144 | +4.3% |
| 14 | Hartford, CT | $2,034 | $81,367 | $39.12 | 136 | +3.2% |
| 15 | Tampa, FL | $2,001 | $80,054 | $38.49 | 133 | -0.1% |
| 16 | Baltimore, MD | $1,948 | $77,913 | $37.46 | 130 | +2.6% |
| 17 | Orlando, FL | $1,942 | $77,681 | $37.35 | 129 | +0.7% |
| 18 | Denver, CO | $1,922 | $76,896 | $36.97 | 128 | -0.6% |
| 19 | Philadelphia, PA | $1,911 | $76,444 | $36.75 | 127 | +3.6% |
| 20 | Virginia Beach, VA | $1,891 | $75,641 | $36.37 | 126 | +6.6% |
| 21 | Atlanta, GA | $1,853 | $74,119 | $35.63 | 124 | +2.0% |
| 22 | Portland, OR | $1,818 | $72,712 | $34.96 | 121 | +0.6% |
| 23 | Nashville, TN | $1,813 | $72,537 | $34.87 | 121 | +0.8% |
| 24 | Charlotte, NC | $1,749 | $69,953 | $33.63 | 117 | +1.0% |
| 25 | Las Vegas, NV | $1,742 | $69,682 | $33.50 | 116 | +0.1% |
| 26 | Richmond, VA | $1,729 | $69,149 | $33.24 | 115 | +2.5% |
| 27 | Phoenix, AZ | $1,722 | $68,879 | $33.11 | 115 | +0.7% |
| 28 | Minneapolis, MN | $1,719 | $68,768 | $33.06 | 115 | +3.5% |
| 29 | Jacksonville, FL | $1,696 | $67,850 | $32.62 | 113 | +1.8% |
| 30 | Raleigh, NC | $1,675 | $67,017 | $32.22 | 112 | +0.8% |
| 31 | Dallas, TX | $1,659 | $66,380 | $31.91 | 111 | +0.4% |
| 32 | Houston, TX | $1,643 | $65,713 | $31.59 | 110 | 0.0% |
| 33 | Salt Lake City, UT | $1,641 | $65,639 | $31.56 | 109 | +0.5% |
| 34 | Austin, TX | $1,622 | $64,887 | $31.20 | 108 | 0.0% |
| 35 | New Orleans, LA | $1,598 | $63,928 | $30.73 | 107 | +1.4% |
| 36 | Milwaukee, WI | $1,563 | $62,502 | $30.05 | 104 | +5.0% |
| 37 | Indianapolis, IN | $1,552 | $62,076 | $29.84 | 103 | +3.3% |
| 38 | Kansas City, MO | $1,529 | $61,145 | $29.40 | 102 | +3.6% |
| 39 | Detroit, MI | $1,524 | $60,949 | $29.30 | 102 | +3.8% |
| 40 | Cincinnati, OH | $1,522 | $60,873 | $29.27 | 101 | +2.6% |
| 41 | Columbus, OH | $1,521 | $60,859 | $29.26 | 101 | +2.6% |
| 42 | Pittsburgh, PA | $1,469 | $58,754 | $28.25 | 98 | +3.4% |
| 43 | Cleveland, OH | $1,454 | $58,159 | $27.96 | 97 | +4.5% |
| 44 | Buffalo, NY | $1,449 | $57,941 | $27.86 | 97 | +3.5% |
| 45 | St. Louis, MO | $1,443 | $57,717 | $27.75 | 96 | +3.9% |
| 46 | Birmingham, AL | $1,433 | $57,311 | $27.55 | 96 | +2.0% |
| 47 | San Antonio, TX | $1,422 | $56,867 | $27.34 | 95 | -1.3% |
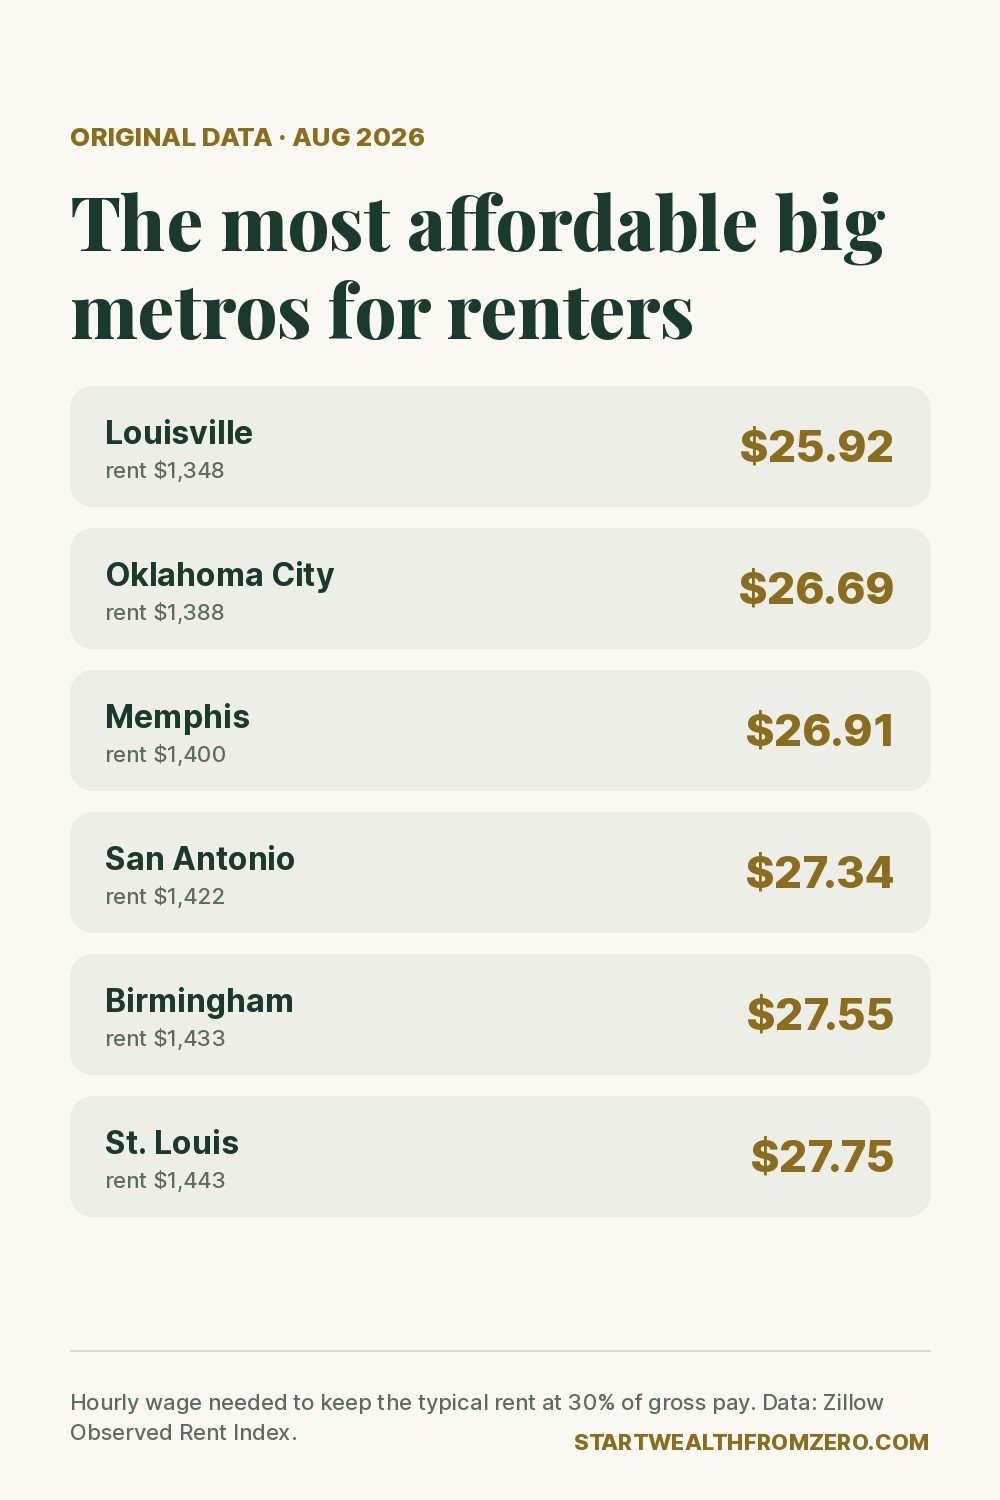
| 48 | Memphis, TN | $1,400 | $55,982 | $26.91 | 93 | +1.0% |
| 49 | Oklahoma City, OK | $1,388 | $55,512 | $26.69 | 93 | +2.3% |
| 50 | Louisville, KY | $1,348 | $53,914 | $25.92 | 90 | +1.6% |
Metro areas are Zillow’s definitions, which follow federal metropolitan statistical areas, so “New York” includes its suburbs in New Jersey and Connecticut, and “Riverside” is the Inland Empire around Riverside and San Bernardino.
What Stands Out
The 30% rule and the landlord’s 40× rule give the same answer
Many landlords ask for gross yearly income of at least 40 times the monthly rent. Since 12 ÷ 0.30 = 40, that’s mathematically the same as the 30% rule. So the “yearly income needed” column is also roughly what a landlord using the 40× test will want to see on your application — from about $53,900 in Louisville to $152,600 in San Jose.
Rents fell in only four of the 50 metros
Typical rent was lower than a year earlier in Tampa, Denver, San Antonio and Austin, and flat in Houston. The biggest increases were in San Francisco (+10.8%), San Jose (+7.6%) and Virginia Beach (+6.6%).
The cheapest big metros still need about $26–$30 an hour
Even in the most affordable large metros — Louisville, Oklahoma City, Memphis, San Antonio, Birmingham and St. Louis — the typical rent needs roughly $54,000–$58,000 of income. Since 2019, rents in several of these lower-cost metros grew faster than the national rate: Cleveland is up about 53% and Buffalo about 49%, versus about 40% for the U.S.
What This Means If You Earn Less
Most people don’t earn what these tables say, and they still rent. The 30% line is a guideline, not a law — housing researchers use it to mark renters as “cost-burdened.” Here’s how people close the gap:
- Rent below the typical level. The index measures the middle of the market across all rental homes, including houses. A smaller or older apartment, or a room in a shared place, often costs well under the typical rent.
- Share the rent. Splitting a $1,948 rent between two people puts each share at $974, which is under 30% of gross income for anyone earning about $39,000 or more.
- Use a guarantor or a larger deposit if your income is below a landlord’s 40× requirement. Policies vary by landlord and state.
- Budget around the rent, not the rule. If rent takes 35–40% of your income, the rest of the budget has to be tighter. Our guide on how much rent you can afford on $50,000 shows what that looks like in practice, and how to budget on $15 an hour works through a lower income.
More ideas in our guides on how to negotiate rent and how to save money on rent.
Methodology
- Rent data: the Zillow Observed Rent Index (ZORI) for all homes plus multifamily, smoothed, by metro area, for August 2026 (the latest month available when we pulled the data). ZORI is Zillow’s measure of typical market-rate asking rent in an area. See Zillow’s ZORI methodology.
- Which metros: the 50 largest metro areas in the dataset by Zillow’s size rank that have August 2026 data.
- Income needed: monthly rent × 12 ÷ 0.30.
- Hourly wage needed: income needed ÷ 2,080 hours (40 hours a week, 52 weeks a year).
- Hours at $15/hr: monthly rent ÷ $15.
- Limitations: ZORI reflects asking rents for homes listed for rent, not what every current tenant pays, and it covers all home types and sizes, so it isn’t the rent of a one-bedroom specifically. Utilities aren’t included. Income figures are pre-tax.
You’re welcome to use these figures and the chart with a link back to this page as the source.
Frequently Asked Questions
How much do you need to make to afford rent in the U.S.?
With the typical U.S. rent at $1,948 a month in August 2026, you need about $77,900 a year, or $37.46 an hour full time, to keep rent at 30% of gross income.
Which large metro needs the highest income to afford rent?
San Jose, California: the typical rent of $3,815 a month needs about $152,600 a year, or $73.37 an hour.
Which large metro is the most affordable for renters?
Louisville, Kentucky, where the typical rent of $1,348 a month needs about $53,900 a year, or $25.92 an hour.
Can you afford rent on $15 an hour?
Not the typical rent in any of the 50 largest metros on one full-time income: 30% of $31,200 is $780 a month, and the lowest typical rent in our list is $1,348. Most people at that wage share housing or rent below the typical level.
Sources
Analysis by Marcos Moreno, Wealth From Zero, using Zillow data. Wealth From Zero is not affiliated with Zillow. This article is for education, not personal financial advice.